
2021-04-20 11:06
تحليل السوقGold Price Breakout on Hold as Yields Rise, GLD ETF Clocks Outflows.
المنتجات ذات الصلة:
الفوركس
تحليل السوق:
Gold Price Breakout on Hold as Yields Rise, GLD ETF Clocks Outflows.
GOLD PRICE FORECAST:
The gold-tracking GLD ETF has seen a consistent wave of outflows since August although withdrawals have slowed in recent weeks
Gold price gains will also have to negotiate US Treasury yields which rose slightly to start the week
What is an ETF? All you Need to Know About Exchange Traded Funds
GOLD PRICE BREAKOUT ON HOLD AS YIELDS RISE, GLD ETF CLOCKS OUTFLOWS
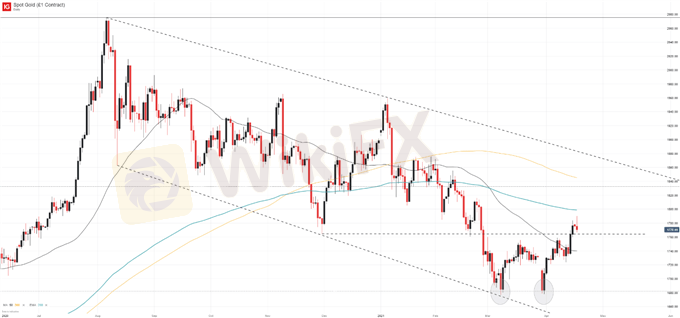
Gold’s price reversal was put on pause early this week as rising Treasury yields worked to undermine the recent breakout above resistance. Recent price action has established an encouraging technical backdrop for the precious metal after a double bottom formation gave way to a quick surge above resistance at $1,765. Now with resistance behind it, gold can take aim at the $1,800 mark with prior barriers offering potential support moving forward.
GOLD PRICE CHART: DAILY TIME FRAME (JUNE 2020 – APRIL 2021)
إعجاب 0

Rey
المتداول
مناقشة حية
الصناعة
NFP updates URDU
الصناعة
دوج كوين
الصناعة
دوجكوين
الصناعة
لقاحات كورونا
الصناعة
صعود الذهب
الصناعة
السيارات
فئة المنتدى

منصة

المعرض

الوكيل

التوظيف

استيراتيجية التداول التلقائي

الصناعة

السوق

المؤشر
Gold Price Breakout on Hold as Yields Rise, GLD ETF Clocks Outflows.
المملكة المتحدة | 2021-04-20 11:06Gold Price Breakout on Hold as Yields Rise, GLD ETF Clocks Outflows.
GOLD PRICE FORECAST:
The gold-tracking GLD ETF has seen a consistent wave of outflows since August although withdrawals have slowed in recent weeks
Gold price gains will also have to negotiate US Treasury yields which rose slightly to start the week
What is an ETF? All you Need to Know About Exchange Traded Funds
GOLD PRICE BREAKOUT ON HOLD AS YIELDS RISE, GLD ETF CLOCKS OUTFLOWS
Gold’s price reversal was put on pause early this week as rising Treasury yields worked to undermine the recent breakout above resistance. Recent price action has established an encouraging technical backdrop for the precious metal after a double bottom formation gave way to a quick surge above resistance at $1,765. Now with resistance behind it, gold can take aim at the $1,800 mark with prior barriers offering potential support moving forward.
GOLD PRICE CHART: DAILY TIME FRAME (JUNE 2020 – APRIL 2021)
الفوركس
إعجاب 0
أريد أن اترك تعليق
تقديم
0تعليقات

لا توجد تعليقات حتى الآن ، كن أول شخص يعلق
تقديم
لا توجد تعليقات حتى الآن ، كن أول شخص يعلق