2020-05-06 09:42
Technical indexGVZ (GOLD VOLATILITY) TECHNICAL ANALYSIS: DAILY PR
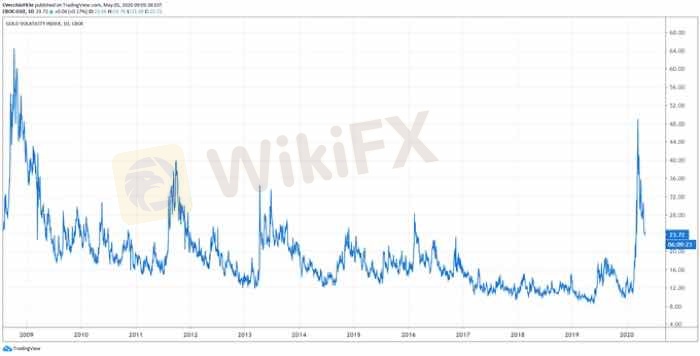
Gold volatility (as measured by the Cboe’s gold volatility ETF, GVZ, which tracks the 1-month implied volatility of gold as derived from the GLD option chain) is trading at 23.72, breaking its coronavirus pandemic low set on March 16 at 23.96. It’s worth noting that, despite gold volatility breaking its coronavirus pandemic lows, gold prices have not: gold prices were trading at 1696.94 at the time this report was written; on March 16, gold prices traded as low as 1451.43.
As such, the 5-day correlation between GVZ and gold prices is 0.08 while the 20-day correlation is -0.41; one week ago, on April 28, the 5-day correlation was 0.68 and the 20-day correlation was -0.43; and one month ago, on April 7, the 5-day correlation was 0.99 and the 20-day correlation was -0.55.
It remains the case that, as has occurred many times over the past year, when gold volatility falls but gold prices do not follow, leading to a situation of negative correlations in the short-term, it has typically indicated a digestion period for the market prior to further gains. If history is a guide, the recent sideways move in gold prices in context of the decline in gold volatility may be setting up the conditions for a rally after all.
Like 1

TPKNX
Participants
Hot content
Industry
Event-A comment a day,Keep rewards worthy up to$27
Industry
Nigeria Event Giveaway-Win₦5000 Mobilephone Credit
Industry
Nigeria Event Giveaway-Win ₦2500 MobilePhoneCredit
Industry
South Africa Event-Come&Win 240ZAR Phone Credit
Industry
Nigeria Event-Discuss Forex&Win2500NGN PhoneCredit
Industry
[Nigeria Event]Discuss&win 2500 Naira Phone Credit
Forum category

Platform

Exhibition

Agent

Recruitment

EA

Industry

Market

Index


Submit
There is no comment yet. Make the first one.