
2021-03-22 17:00
IndustryUS Dollar Outlook
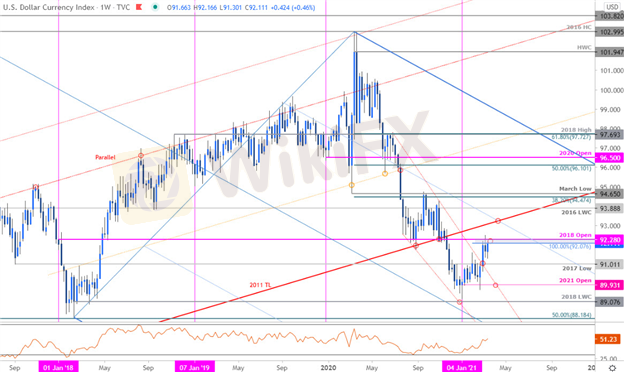
The US Dollar Index higher this week with the DXY rallying 0.37% to trade at 92.02 in early New York trade on Friday. The advance comes amid a volatile week for the greenback with the initial FOMC sell-off reversing sharply into the close of the week. Despite a range of nearly 1%, the index remains just below a critical technical resistance barrier we’ve been tracking for months and the focus remains on possible inflection off this zone for guidance. These are the updated technical targets and invalidation levels that matter on the US Dollar Index price chart heading into next week.
We noted that the DXY breakout was faltering, “at the 92.28 resistance zone- the advance may be vulnerable while below this threshold.” The Index plunged 1.3% off the highs into the FOMC rate decision this week before reversing sharply higher with the DXY now once again testing this major technical zone.
Weekly resistance unchanged at the 100% extension / the 2018 yearly open / August low close at 92.08/30–a breach / close above this zone is needed to keep the long-bias viable towards the highlighted trendline confluence near ~93.20s- area of interest for possible topside exhaustion IF reached. Initial support steady at the 2017 swing low at 91.01 with broader bullish invalidation at the objective yearly open at 89.93.
Like 2

FX1641490553
Trader
Hot content
Industry
Event-A comment a day,Keep rewards worthy up to$27
Industry
Nigeria Event Giveaway-Win₦5000 Mobilephone Credit
Industry
Nigeria Event Giveaway-Win ₦2500 MobilePhoneCredit
Industry
South Africa Event-Come&Win 240ZAR Phone Credit
Industry
Nigeria Event-Discuss Forex&Win2500NGN PhoneCredit
Industry
[Nigeria Event]Discuss&win 2500 Naira Phone Credit
Forum category

Platform

Exhibition

Agent

Recruitment

EA

Industry

Market

Index
US Dollar Outlook
India | 2021-03-22 17:00The US Dollar Index higher this week with the DXY rallying 0.37% to trade at 92.02 in early New York trade on Friday. The advance comes amid a volatile week for the greenback with the initial FOMC sell-off reversing sharply into the close of the week. Despite a range of nearly 1%, the index remains just below a critical technical resistance barrier we’ve been tracking for months and the focus remains on possible inflection off this zone for guidance. These are the updated technical targets and invalidation levels that matter on the US Dollar Index price chart heading into next week.
We noted that the DXY breakout was faltering, “at the 92.28 resistance zone- the advance may be vulnerable while below this threshold.” The Index plunged 1.3% off the highs into the FOMC rate decision this week before reversing sharply higher with the DXY now once again testing this major technical zone.
Weekly resistance unchanged at the 100% extension / the 2018 yearly open / August low close at 92.08/30–a breach / close above this zone is needed to keep the long-bias viable towards the highlighted trendline confluence near ~93.20s- area of interest for possible topside exhaustion IF reached. Initial support steady at the 2017 swing low at 91.01 with broader bullish invalidation at the objective yearly open at 89.93.
Like 2
I want to comment, too
Submit
0Comments

There is no comment yet. Make the first one.
Submit
There is no comment yet. Make the first one.