
2022-04-20 23:06
Market analysisDOW JONES, NASDAQ 100, S&P 500 TECHNICAL OUTLOOK
Related product:
Forex,Stock
Market analysis:
DOW JONES, NASDAQ 100, S&P 500 TECHNICAL OUTLOOK
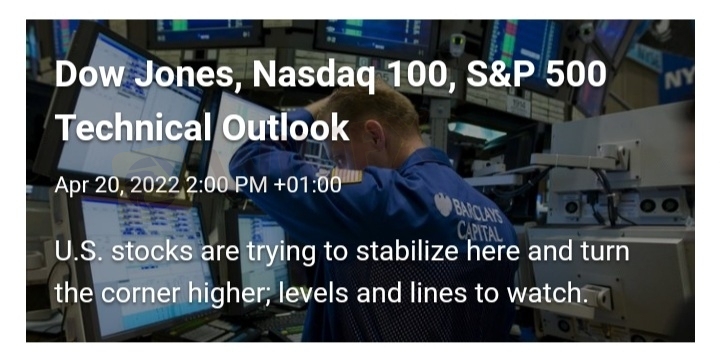
The S&P 500 is trying to turn higher here after coming into the week looking like it may want to continue lower, at least in the near-term. The turn could start to carve out the right shoulder of an inverse head-and-shoulders pattern.
If this pattern were to eventually trigger, it would set the market up to trade to fresh record highs. There is still a lot of room, though, for this pattern to not reach the point of validation as it would need to climb above 4637 to have a shot at doing so.
The first level up to contend with (again) is the 200-day MA at 4496. The market is poised to have that battle today given pre-market futures are trading higher. Beyond that point there is any highly meaningful resistance until the trend-line off the record high, which isn’t until around 4575.
It will be important that the market holds this week’s current low at 4370 for the outlook to remain intact. A decline below 4370 won’t necessarily take out the inverse H&S scenario completely, but will certainly undermine its likelihood and increase the chances that we see a test or worse of the Feb low.
Like 0

Aminuhassan
Trader
Hot content
Industry
Event-A comment a day,Keep rewards worthy up to$27
Industry
Nigeria Event Giveaway-Win₦5000 Mobilephone Credit
Industry
Nigeria Event Giveaway-Win ₦2500 MobilePhoneCredit
Industry
South Africa Event-Come&Win 240ZAR Phone Credit
Industry
Nigeria Event-Discuss Forex&Win2500NGN PhoneCredit
Industry
[Nigeria Event]Discuss&win 2500 Naira Phone Credit
Forum category

Platform

Exhibition

Agent

Recruitment

EA

Industry

Market

Index
DOW JONES, NASDAQ 100, S&P 500 TECHNICAL OUTLOOK
Nigeria | 2022-04-20 23:06DOW JONES, NASDAQ 100, S&P 500 TECHNICAL OUTLOOK
The S&P 500 is trying to turn higher here after coming into the week looking like it may want to continue lower, at least in the near-term. The turn could start to carve out the right shoulder of an inverse head-and-shoulders pattern.
If this pattern were to eventually trigger, it would set the market up to trade to fresh record highs. There is still a lot of room, though, for this pattern to not reach the point of validation as it would need to climb above 4637 to have a shot at doing so.
The first level up to contend with (again) is the 200-day MA at 4496. The market is poised to have that battle today given pre-market futures are trading higher. Beyond that point there is any highly meaningful resistance until the trend-line off the record high, which isn’t until around 4575.
It will be important that the market holds this week’s current low at 4370 for the outlook to remain intact. A decline below 4370 won’t necessarily take out the inverse H&S scenario completely, but will certainly undermine its likelihood and increase the chances that we see a test or worse of the Feb low.
Forex
Stock
Like 0
I want to comment, too
Submit
0Comments

There is no comment yet. Make the first one.
Submit
There is no comment yet. Make the first one.