2021-05-12 14:52
Анализ котировокBitcoin remains bullish despite bearish ABC pullback in wave 4
Схожие варианты:
Форекс
Анализ котировок:
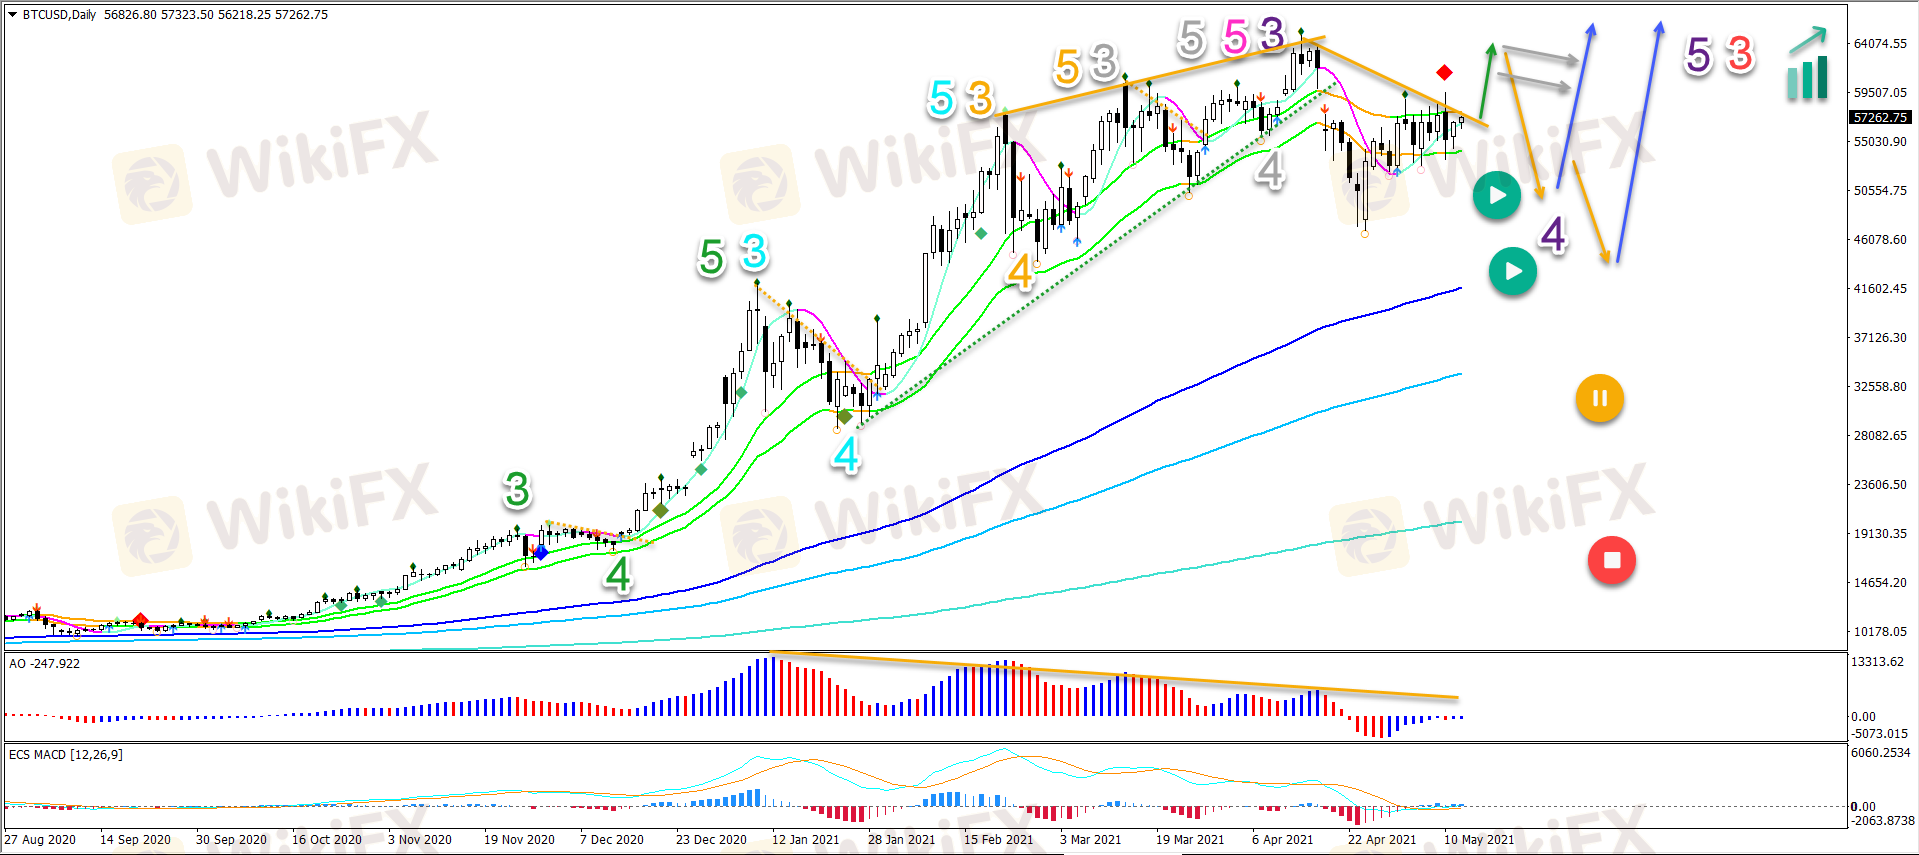
Bitcoin remains bullish despite bearish ABC pullback in wave 4.
Bitcoin made a first bearish break below the 21 ema zone since September 2020. But signs of the overall uptrend remain strong with all the moving averages aligned.
The strong push above the 21 ema is typical for a wave 3 (purple). This means that the bearish breakout below the 21 ema zone is probably a wave 4 (purple)
A continuation pattern like a bull flag (grey arrows) could indicate an immediate uptrend (blue arrow). The next targets could aim at the $75-80k levels.
This article reviews the key Elliott Wave patterns and chart patterns. We also analyse what to expect next in the path of least resistance.
Rey
Трейдер
Популярные обсуждения
Технический показатель
Розыгрыш Xiaomi Redmi Note 9 и 20-и VIP-подписок
Технический показатель
Европа заключила совместный контракт на поставку ремдесивира для лечения COVID-19...
Технический показатель
Индия: Решение Резерв. Банка Индии по проц. ставке, 4%, ожидалось 4%...
Анализ котировок
Китай: Индекс деловой актив. в сф. услуг Caixin PMI, Сентябрь, 54,8 п.
Технический показатель
События предстоящего дня: "АЛРОСА" опубликует результаты продаж за сентябрь...
Технический показатель
Власти Италии придумали новый способ убедить население отказаться от наличных...
Классификация рынка

Платфоома

Выставка

Агент

Вакансии

EA

Отраслевой

Котировки

Показатель
Bitcoin remains bullish despite bearish ABC pullback in wave 4
 Филиппины | 2021-05-12 14:52
Bitcoin remains bullish despite bearish ABC pullback in wave 4.
Bitcoin made a first bearish break below the 21 ema zone since September 2020. But signs of the overall uptrend remain strong with all the moving averages aligned.
The strong push above the 21 ema is typical for a wave 3 (purple). This means that the bearish breakout below the 21 ema zone is probably a wave 4 (purple)
A continuation pattern like a bull flag (grey arrows) could indicate an immediate uptrend (blue arrow). The next targets could aim at the $75-80k levels.
This article reviews the key Elliott Wave patterns and chart patterns. We also analyse what to expect next in the path of least resistance.
Форекс
Нравится 0
Я тоже хочу высказать замечания.
Задать вопрос
0Комментарии

Пока нет комментариев, оставьте комментарий первым


Задать вопрос
Пока нет комментариев, оставьте комментарий первым