
2021-04-26 11:42
行情分析Chainlink price bulls not active at current levels, leaving LINK vulnerable to a 25% decline
相關品種:
外匯
行情分析:
Chainlink price bulls not active at current levels, leaving LINK vulnerable to a 25% decline.
Chainlink price forges descending channel with midline restraining rebounds.
A series of 20% declines in April keeps speculators’ fingers off the buy button.
iTrustCapital, the #1 Crypto IRA platform, announces that LINK is now available on their platform.
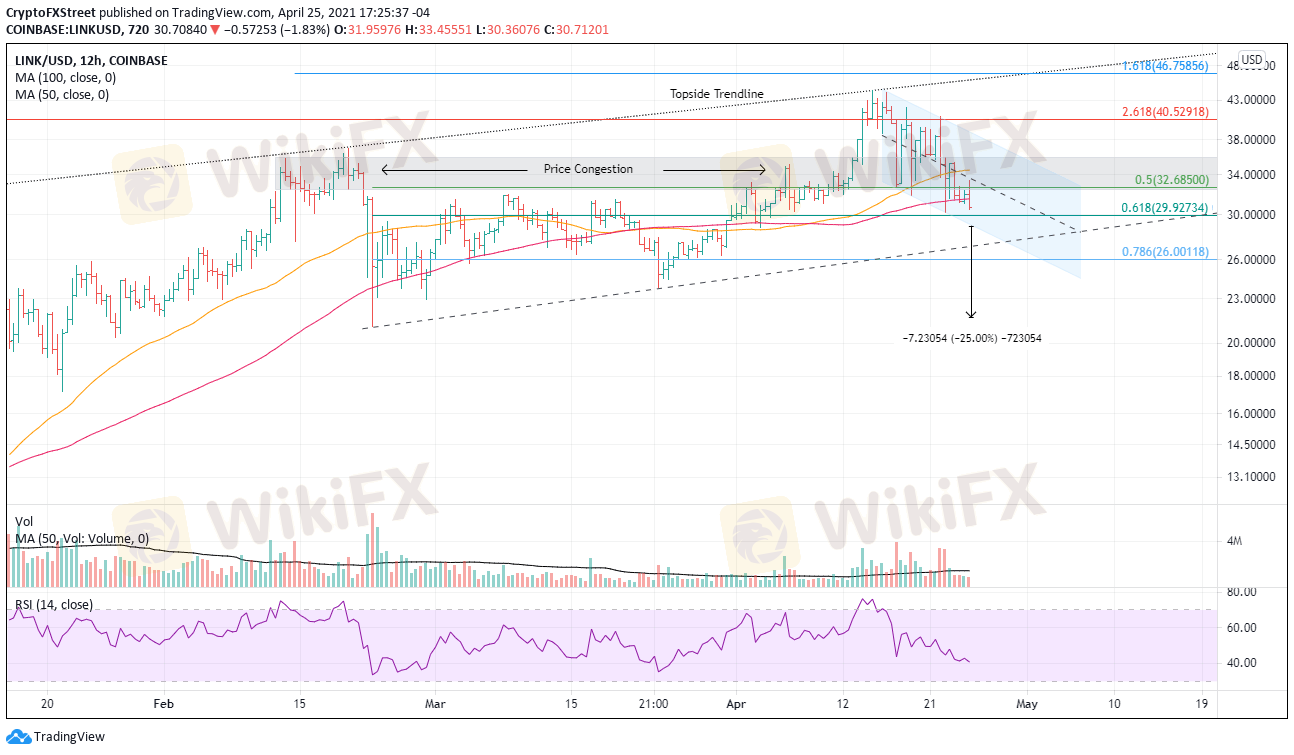
Chainlink price is facing the test of overcoming the momentum of the descending channel and the price congestion between $32.70 and $35.75. A downside trajectory will continue to define the LINK charts in the short term.
Chainlink price looking down for shelter
LINK has been moving at breakneck speed in the cryptocurrency space as the number of projects adopting its oracle grows exponentially. However, the token price has been overwhelmed by the weakness in the broader market, keeping the strong bids on the sidelines.
Despite the selling, LINK does have an impressive range of support between $27.99 and $30.88, according to Intotheblock In/Out of the Money Around Price (IOMAP) data. A total of 46.24k addresses bought 66.48 million LINK. The range extends from just below the lower trend line of the channel to the 100 twelve-hour simple moving average (SMA), suggesting that a significant sell-off from current levels may not occur.
Contrary to the data point above, the charts illustrate a different picture for LINK. Before stalling at the topside trendline at $40.34 in mid-February, the digital token has swung according to the technicals, and that is not likely to change soon.
Note, LINK has crushed support at the 50% retracement of the February decline at $32.68, the 50-day SMA at $31.39, and got within a percent of the 61.8% Fibonacci retracement. The next critical support is the channel’s lower trend line at $28.90. A daily close below the trend line will usher in a test of the rising trend line from the February low at $27.10.
More significant losses could follow, including a test of the March 24 low at $23.75 and lastly, the channel’s measured move target at $21.68, representing a loss of 25% from the channel’s lower trend line.
贊 0

Rey
交易者
熱門討論
業內
哎,现在明白不赌就是赢啊
行情分析
美元/加元技术面
業內
[活動]論交易,贏取200元話費補貼
技術指標
EZ.Fury Kite是基于趋势指标MA进行判断
技術指標
外汇技术分析之波浪理论
技術指標
指标派是什么?
市集分類

平臺

展會

代理商

招聘

EA

業內

行情

指標
Chainlink price bulls not active at current levels, leaving LINK vulnerable to a 25% decline
英國 | 2021-04-26 11:42Chainlink price bulls not active at current levels, leaving LINK vulnerable to a 25% decline.
Chainlink price forges descending channel with midline restraining rebounds.
A series of 20% declines in April keeps speculators’ fingers off the buy button.
iTrustCapital, the #1 Crypto IRA platform, announces that LINK is now available on their platform.
Chainlink price is facing the test of overcoming the momentum of the descending channel and the price congestion between $32.70 and $35.75. A downside trajectory will continue to define the LINK charts in the short term.
Chainlink price looking down for shelter
LINK has been moving at breakneck speed in the cryptocurrency space as the number of projects adopting its oracle grows exponentially. However, the token price has been overwhelmed by the weakness in the broader market, keeping the strong bids on the sidelines.
Despite the selling, LINK does have an impressive range of support between $27.99 and $30.88, according to Intotheblock In/Out of the Money Around Price (IOMAP) data. A total of 46.24k addresses bought 66.48 million LINK. The range extends from just below the lower trend line of the channel to the 100 twelve-hour simple moving average (SMA), suggesting that a significant sell-off from current levels may not occur.
Contrary to the data point above, the charts illustrate a different picture for LINK. Before stalling at the topside trendline at $40.34 in mid-February, the digital token has swung according to the technicals, and that is not likely to change soon.
Note, LINK has crushed support at the 50% retracement of the February decline at $32.68, the 50-day SMA at $31.39, and got within a percent of the 61.8% Fibonacci retracement. The next critical support is the channel’s lower trend line at $28.90. A daily close below the trend line will usher in a test of the rising trend line from the February low at $27.10.
More significant losses could follow, including a test of the March 24 low at $23.75 and lastly, the channel’s measured move target at $21.68, representing a loss of 25% from the channel’s lower trend line.
外匯
贊 0
我也要評論
提問
0條評論

還沒人評論,趕緊搶佔沙發
提問
還沒人評論,趕緊搶佔沙發